Instagram Reels Statistics 2026: Key Stats and What They Mean for Growth

Updated on
January 30, 2026
| Maria Harutyunyan
| 10 Min Read
Twitter IconFacebook IconInstagram IconLinkedIn Icon

Instagram doesn't hide its priorities. In 2023, the platform openly restructured its algorithm to favor Reels, granting the format preferential placement in the Explore grid, the Reels tab, and the main feed. The impact was immediate. Time spent on Instagram jumped 24%. During a Meta quarterly earnings call, Mark Zuckerberg confirmed what creators and brands already suspected: "On Instagram, Reels and video continue to drive engagement, with Reels alone now making up 50% of the time that's spent within the app."

The math is simple. Instagram actively amplifies Reels to non-followers, serves them more frequently than static posts, and has built its entire discovery system around short-form video. For anyone trying to grow an audience, drive sales, or capture attention on the platform, Reels isn't one option among many. It is the option.

This report brings together the most important Instagram Reels statistics as of the start of 2026: who's watching, how the format performs, what drives engagement, and how brands are turning views into revenue. These are benchmarks, backed by platform data and measurable results, designed to help you make smarter decisions about where your content strategy should focus.

We keep things up to date with fresh data every quarter. This is the Q1 2026 edition.

Key Instagram Reels Statistics (2026 Snapshot)

  • Instagram Reels now drive 50% of all time spent on the platform, making them the dominant content format for user attention.
  • Reels generate 140 billion daily views across nearly 2 billion monthly users, giving brands massive reach potential at scale.
  • The average Reels reach rate is 30.81%, more than 2× higher than carousels, image posts, and Stories.
  • 55% of Reels views come from non-followers, making them Instagram’s strongest discovery format for new audiences.
  • Brands that integrate Reels into their marketing strategies see an average 29% increase in ROI.
  • Reels generate a 41% higher click-through rate to brand websites compared to static ads.
  • Reel ads now account for 22.2% of all Instagram ad placements, with a potential reach of 726.8 million users.
  • Smaller accounts consistently achieve higher engagement rates on Reels than profiles with 100K-1M followers.
  • Reels between 60-90 seconds receive the highest engagement and view rates, challenging the “shorter is always better” assumption.
  • For ecommerce brands, Instagram Reels deliver 1.3× higher conversion rates than TikTok.

Instagram’s Global Reach and Market Penetration

Let’s look at Instagram’s general audience size and demographics:

  • Instagram has 3 billion monthly active users as of September 2025, up from 2 billion in 2022 (Source).
  • India leads with 414 million users, followed by the U.S. (172M) and Brazil (140M) (Source).
  • 50% of U.S. adults use Instagram, making it the third most popular social platform after YouTube (84%) and Facebook (71%) (Source).
  • Instagram.com is the 4th most-visited website globally, behind Google, YouTube, and Facebook (Source).
  • Instagram is the top platform for U.S. users aged 13-28 (Source).
  • The largest global age group is 25-34, representing 31%+ of the audience. 55% of Instagram users are women. (Source)
  • U.S. users spend an average of 16 minutes per day on Instagram. Users aged 18-24 spend 43 minutes per day on the platform. (Source)
  • Instagram’s audience grew 5.5% year over year in early 2025 (Source).

How Do People Use Instagram?

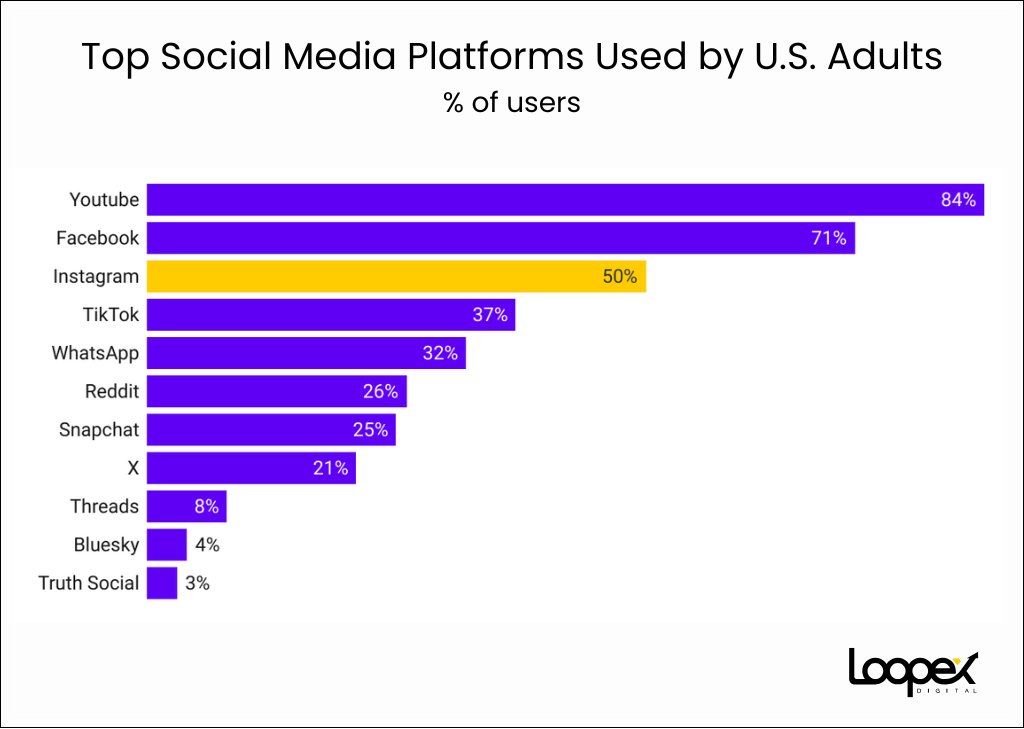
According to recent Instagram statistics (Source):

  • 86% of users use Instagram primarily for entertainment.
  • 36% use it to discover products and ideas, similar to a search engine.

This behavior shift explains why Instagram now supports both passive content consumption and active buying intent in the same user journey.

Instagram’s Commercial Influence

Instagram plays a central role in both digital advertising and social commerce.

Instagram shoppers lead all social platforms in high-value purchases (Source):

  • 7.6% more users spend over $200 compared to other platforms
  • 8.7% spend over $700

Takeaway: Instagram combines cultural influence with real purchasing behavior. Brands that treat it as both a content platform and a commerce channel outperform those that only use it for awareness.

Instagram Reels Usage and Content Dominance

Reels now account for most of Instagram's attention. The format accounts for half of all time spent on the platform and makes up over a third of feed content. This shift has turned Reels into Instagram’s primary content format.

How Widely Reels Are Used

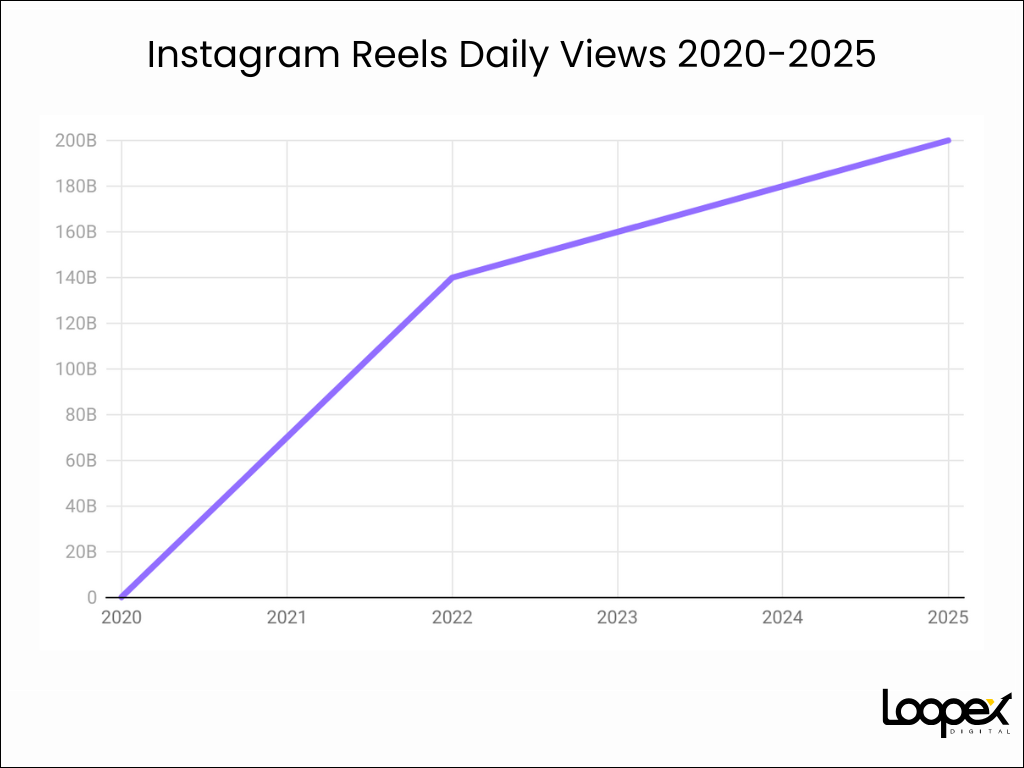
This level of consumption explains why Reels dominate both feed placement and algorithmic distribution.

Reels’ Share of Instagram Content

Reels Sharing and Viral Reach

  • According to Meta, Instagram Reels are reshared more than 4.5 billion times per day (Source).
  • As of January 2026, the most-watched Reel of all time is a collaboration between actress Deepika Padukone and Hilton Hotels, with 1.9 billion views (Source).

High reshare rates explain why Reels outperform static posts for discovery and viral reach.

Instagram Reels Audience Demographics and Device Usage

Reels are most popular among young, urban users who primarily consume content on mobile devices. The format performs strongest with Gen Z and younger Millennials, especially those aged 18-24, who spend significantly more time watching Reels than older age groups.

This audience profile shapes how Reels content should be designed, distributed, and optimized for engagement.

Age and Gender Distribution

  • 62% of Instagram Reels users are mostly 18-34 (Source).
  • Gender split is nearly even: 47.8% male and 46.7% female (Source).
  • 34% of Gen Z users regularly interact with Reels (Source).
  • Users aged 18-24 spend 44 minutes per day watching Reels, while those aged 35+ spend an average of 18 minutes per day (Source).

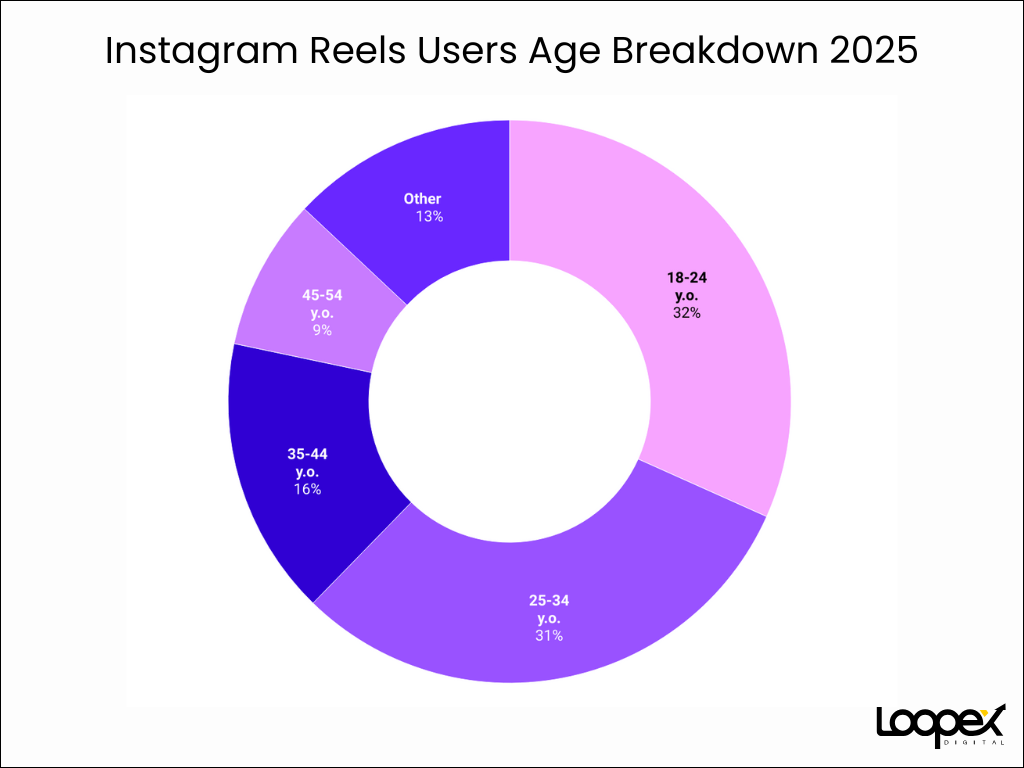
Engagement peaks among 18-24-year-olds (Source):

  • 16.5% for men
  • 15.2% for women

Urban Concentration

Based on the latest studies (Source):

  • 63% of Reels viewers live in urban areas.
  • 37% are based in suburban or rural regions.

Reels usage is strongest in cities, where social trends and digital commerce adoption are typically higher.

Mobile and Device Usage

Instagram Reels statistics show that (Source):

  • 55% of Reels users access the platform via Android devices.
  • 35% use iOS (Apple) devices.

Reel consumption is overwhelmingly mobile-first, with Android accounting for the largest share of users.

Instagram Reels Performance Compared to Other Formats

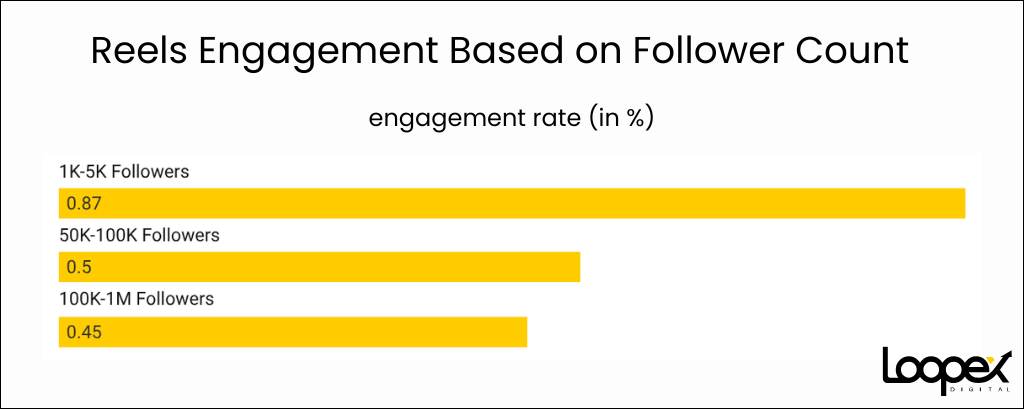
Reels consistently outperform other Instagram formats in reach, impressions, and engagement. Their short-form, mobile-first structure aligns with how users consume content, giving them stronger algorithmic distribution and higher visibility, especially for smaller accounts.

Engagement and Interaction Benchmarks

  • Instagram Reels average 2.46% engagement, above the platform’s 2% overall average (Source).
  • 66% of consumers say short-form video is the most engaging content type.
  • The average Reel receives 243 likes, 8 comments, and 28 saves (Source).

Smaller accounts perform best on Reels (Source):

  • 0.87% engagement for 1K-5K followers
  • 0.50% for 50K-100K
  • 0.45% for 100K-1M

Reach and Impressions

Reels have an average reach rate of 30.81%, more than double (Source):

  • Carousels (14.45%)
  • Image posts (13.14%)

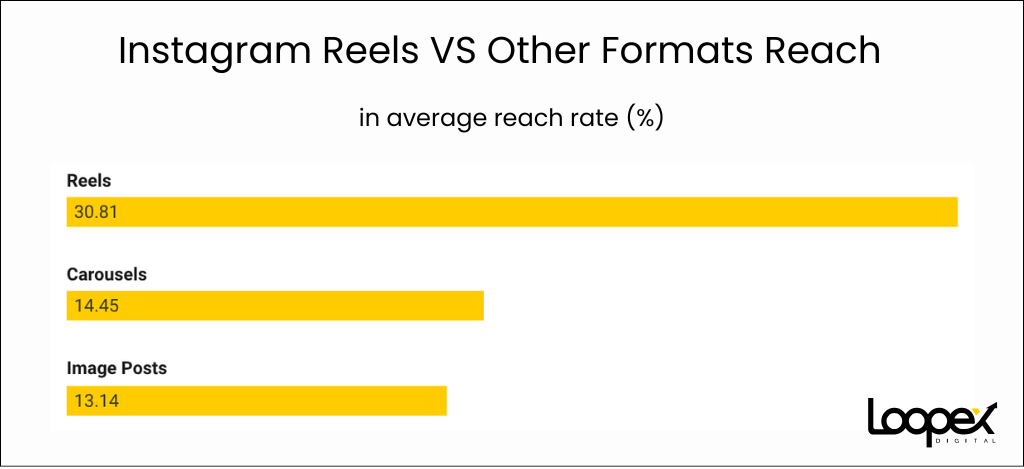
Last year, Reels averaged 11,000 views per post, the highest of any format (Source). The average Reel impression rate is 33.83%. This explains why Reels dominate discovery and feed visibility across the platform.

Format Performance by Account Size

Reels generate more impressions for accounts with fewer than 50K followers. Carousels perform better for larger pages. (Source)

For newer and mid-sized accounts, Reels offer the fastest path to exposure.

Instagram Reels Advertising Adoption and Performance

  • Instagram Reels has a total potential ad audience of 726.8 million people.
  • Reel ads now represent 22.2% of all Instagram ad placements
  • U.S. marketers spent $2.56 billion on Instagram influencer marketing in 2024, with most of that budget allocated to Reels (Source).
  • In Q2 2025, Reels accounted for 21% of all US ad impressions on Instagram, behind Stories (44%) and the Feed (31%) (Source).
  • After watching a product video on Instagram, roughly 48% of users take a follow-up action, such as searching for more details or visiting a website. 
  • Business usage of Instagram Reels increased by 57.4% last year. 
  • In the past year, more than 53% of U.S. marketers used Instagram Reels in their influencer marketing campaigns (Source).
  • Marketers consider Instagram Reels the third most effective channel for video marketing (Source).

Instagram Reels Impact on Purchases and Revenue

Reels influence buying decisions across both consumer and B2B markets. The format combines discovery, engagement, and conversion in one channel, making it a direct driver of revenue growth.

Short-form video now plays a central role in how people research, evaluate, and purchase products.

ROI and Marketing Performance

These performance gains explain why Reels now receive a larger share of marketing budgets.

Discovery and Brand Acquisition

Reels function as both a discovery tool and a direct communication channel.

Purchase Behavior by Audience Type

Consumer behavior:

B2B behavior (Source):

  • 70% of B2B buyers now watch videos during purchase research.
  • This represents a 52% increase over two years.

Video content now influences both consumer and professional buying decisions.

Conversion Performance

This indicates stronger purchase intent and post-view action on Instagram’s platform.

High-Performing Instagram Reels Content Patterns

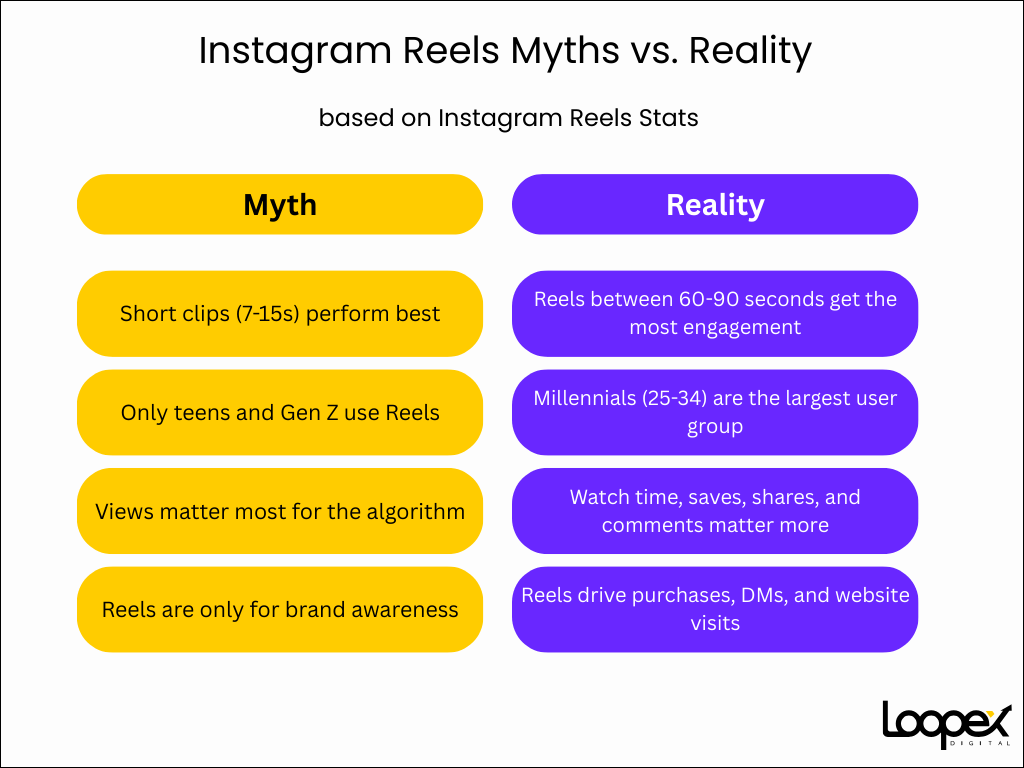
The primary factor Instagram uses to rank Reels is engagement, measured by likes, saves, shares, and comments. Source

Creative Elements That Drive Engagement

  • Reels featuring people receive 25% more clicks than those without.
  • Reels with a storytelling hook or jump cut in the first 3 seconds are 72% more likely to go viral.
  • Reels using trending audio see 42% higher engagement.
  • Reels with a jump cut every 3-5 seconds average 32% higher engagement than single-shot videos (Source).
  • 60% of users say on-screen text improves understanding and enjoyment.
  • 80% of users are more likely to finish a video when captions are available.
  • 80%+ of Reels are watched with sound on.

Fast pacing, audio, captions, and visible human presence improve both retention and interaction.

Content Styles Users Prefer

According to a Statista survey (Source):

  • 50% of users prefer funny Reels.
  • 46% like creative content.
  • 41% prefer informative Reels.
  • 37% enjoy relaxing content.
  • 36% prefer inspirational videos.

A Social Insider survey ranked (Source):

  • Engaging storytelling as the top preference (59%)
  • Followed by authentic, non-promotional content
  • And educational content

Entertainment, authenticity, and value drive consistent engagement.

Performance-Optimized Ad Formats

Instagram Reels statistics reveal some insights about the best-performing ad formats (Source):

  • Vertical 9:16 video ads with sound have a 34.5% lower CPA than image ads.
  • They also have a 15% lower CPA than silent video ads on Reels.

Short-form, sound-on video ads convert more efficiently than static formats.

Publishing Frequency and Timing

  • Creators who post Reels regularly gain followers 25% faster
  • Best posting times in 2026 are 7-9 AM and 11 AM-1 PM (local audience time zone) (Source).

Consistency improves both reach and follower growth.

Length, Hashtags, and Completion Rates

  • Reels between 60-90 seconds receive the highest engagement. 
  • The optimal hashtag count is 3-5 (Source).

Format details directly affect watch time and interaction rates.

All of the Instagram Reels statistics above give you an idea of your content strategy's place, since high-performing Reels follow a clear pattern:

  • Fast hooks in the first 3 seconds
  • Human presence on screen
  • Strong audio and captions
  • Engaging storytelling
  • Regular publishing cadence.

Top Short-Form Video Platforms at a Glance (Compared)

Instagram Reels Youtube Shorts Tiktok
Type Feature within Instagram Feature within YouTube Standalone platform
Video length 15 to 180 seconds 15 to 180 seconds 15 seconds to 10 minutes
Monthly users 2 billion 2 billion 1.59 billion
Daily views 200 billion (incl. Facebook) 200 billion 1 billion
Top country by number of users India India Indonesia
Content discovery Mix of "For You" and followed accounts Shorts Shelf For You Page
Editing tools Wide range of filters, editing tools, and AR effects YouTube's audio library and simple tools Vast, trend-driven library
Linking Link in bio Link stickers leading to the channel Link in bio, website link for Business accounts
Ad formats Reels Ads, Partnership Ads YouTube Shorts ads as part of YouTube's video campaigns In-Feed Ads, Spark Ads, TopView
Shopping features Product tags, Instagram Shop Product tagging in beta TikTok Shop, product links
Logo

Instagram Reels Myths and Realities

Common advice about Reels often doesn’t align with how the platform actually works. Real performance data and Instagram Reels statistics show that engagement, watch time, and content quality matter more than follower count, video length, or hashtags.

Reels succeed when they align with how Instagram’s algorithm prioritizes retention, interaction, and user interest. Brands and creators who base their strategy on these realities, not outdated myths, see stronger reach, engagement, and conversion results.

Methodology: How Was This Instagram Reels Statistics Report Built

This report is based on verified data from industry benchmarks, platform reports, and large-scale social media studies. We prioritized datasets from the past two years and excluded older, time-sensitive figures to ensure the insights reflect current Instagram Reels behavior.

Our selection focused on metrics tied to real performance: reach, engagement, watch time, ad effectiveness, and conversion impact. When multiple sources reported similar trends, we cross-checked the data to confirm consistency.

All insights were analyzed for practical relevance. The goal was to highlight the factors that influence visibility, engagement, and revenue on Instagram today.

Key Takeaways from Instagram Reels Statistics

If your goal is to grow reach, visibility, and revenue on Instagram, the data points to a clear direction:

  • Reels dominate attention. They now account for 50% of all time spent on Instagram and outperform every other format in reach and engagement.
  • Discovery happens beyond your followers. With 55% of views coming from non-followers, Reels are Instagram’s strongest growth tool.
  • Short-form video drives real sales. As part of a broader video marketing strategy, Reels deliver higher CTRs, stronger conversions, and measurable ROI gains.
  • Smaller accounts benefit the most. Reels give newer and mid-sized pages faster exposure than static content.
  • Creative execution matters more than follower count. Engagement, watch time, and storytelling drive performance, not hashtags or account size.

If you want to strengthen your video marketing results and improve your reach and visibility online, our SEO agency can help you build a strategy that turns attention into growth. Contact us to improve your online presence.

References

  • Adam Connell. 32 Top Instagram Reels Statistics For 2025. Accessed on Dec 22, 2025.
    https://adamconnell.me/instagram-reels-statistics/
  • B2B House. Video Marketing Statistics 2024: Latest trends and insights you need to know. Accessed on Dec 22, 2025.
    https://www.theb2bhouse.com/video-marketing-statistics-latest-trends-and-insight-you-need-to-know/
  • CNBC. Instagram now has 3 billion monthly active users. Accessed on Dec 22, 2025.
    https://www.cnbc.com/2025/09/24/instagram-now-has-3-billion-monthly-active-users.html
  • Data Reportal. Instagram Users, Stats, Data & Trends for 2025. Accessed on Dec 22, 2025.
    https://datareportal.com/essential-instagram-stats
  • Demand Sage. How Many Reels Are There On Instagram. Accessed on Dec 22, 2025.
    https://www.demandsage.com/instagram-reel-statistics/
  • Demand Sage. TikTok User Statistics. Accessed on January 13, 2026.
    https://www.demandsage.com/tiktok-user-statistics/
  • Demand Sage. YouTube Shorts Statistics. Accessed on January 13, 2026.
    https://www.demandsage.com/youtube-shorts-statistics/
  • Economic Times. YouTube Shorts Hits 200 Billion Daily Views: CEO Neal Mohan. Accessed on January 13, 2026.
    https://economictimes.indiatimes.com/tech/technology/youtube-shorts-has-hit-200-billion-daily-views-ceo-neal-mohan/articleshow/121968947.cms
  • EMARKETER. Data Drop: 4 Charts on Social Shopping Habits. Accessed on Dec 22, 2025.
    https://www.emarketer.com/content/data-drop-4-charts-on-social-shopping-habits
  • EMARKETER. Gen Zers overindex on every platform we track, particularly social platforms. Accessed on Dec 22, 2025.
    https://www.emarketer.com/content/gen-zers-overindex-on-every-platform-track--particularly-social-platforms
  • EMARKETER. Instagram brings Reels to TV, chasing new ad growth on the big screen. Accessed on Dec 22, 2025.
    https://www.emarketer.com/content/instagram-brings-reels-tv-chasing-new-ad-growth-on-big-screen
  • EMARKETER. Worldwide Ad Spending Forecast 2025. Accessed on Dec 22, 2025.
    https://www.emarketer.com/content/worldwide-ad-spending-forecast-2025
  • Enhencer. 2025 Instagram Reels vs. TikTok Ads: Which Offers Better ROI. Accessed on Dec 22, 2025.
    https://enhencer.com/blog/2025-instagram-reels-vs-tiktok-ads-which-offers-better-roi
  • Facebook. Instagram Reels. Accessed on Dec 22, 2025.
    https://www.facebook.com/business/instagram/instagram-reels
  • Forbes. Is Social Media The New Google? Gen Z Turns To Google 25% Less Than Gen X When Searching. Accessed on Dec 22, 2025.
    https://www.forbes.com/advisor/business/software/social-media-new-google
  • Forbes. Verizon Media Says 69 Percent Of Consumers Watching Video With Sound Off. Accessed on Dec 22, 2025.
    https://www.forbes.com/sites/tjmccue/2019/07/31/verizon-media-says-69-percent-of-consumers-watching-video-with-sound-off
  • Google. The Changing Face of B2B Marketing. Accessed on Dec 22, 2025.
    https://www.thinkwithgoogle.com/consumer-insights/consumer-trends/the-changing-face-b2b-marketing/
  • Grin.co. The Ultimate Guide to Instagram Video Marketing. Accessed on Dec 22, 2025.
    https://grin.co/blog/instagram-video-marketing/
  • Hootsuite. 30 Instagram statistics marketers need to know in 2025. Accessed on Dec 22, 2025.
    https://blog.hootsuite.com/instagram-statistics
  • Hootsuite. Average engagement rates for 12 industries. Accessed on Dec 22, 2025.
    https://blog.hootsuite.com/average-engagement-rate
  • Hootsuite. Instagram hashtags for 2025. Accessed on Dec 22, 2025.
    https://blog.hootsuite.com/instagram-hashtags/
  • Instagram. Instagram Ranking Explained. Accessed on Dec 22, 2025.
    https://about.instagram.com/blog/announcements/instagram-ranking-explained
  • International Journal of Research Publication and Reviews. The Impact of Instagram Reels on Consumer Engagement and Brand Perception. Accessed on Dec 22, 2025.
    https://ijrpr.com/uploads/V6ISSUE6/IJRPR48401.pdf
  • Later. Best Time to Post on Instagram in 2025. Accessed on Dec 22, 2025.
    https://later.com/blog/best-time-to-post-on-instagram
  • Limelight Digital. Instagram Reels Statistics 2025. Accessed on Dec 22, 2025.
    https://www.limelightdigital.co.uk/instagram-reels-statistics
  • Loopex Digital. Video Marketing Statistics To Consider For 2025 Campaigns. Accessed on Dec 22, 2025.
    https://www.loopexdigital.com/blog/video-marketing-statistics
  • Mailchimp. Can You Buy Instagram Followers? Accessed on Dec 22, 2025.
    https://mailchimp.com/resources/can-you-buy-instagram-followers
  • MENTION. Video Content Gets the Most Engagement on Instagram. Accessed on Dec 22, 2025.
    https://mention.com/en/blog/video-engagement-instagram/
  • META. First Quarter 2024 Results Conference Call. Accessed on Dec 22, 2025.
    https://s21.q4cdn.com/399680738/files/doc_financials/2024/q1/META-Q1-2024-Earnings-Call-Transcript.pdf
  • META. More Ways to Reach Customers Through Video, AI-Powered Tools and Improved Ad Formats. Accessed on Dec 22, 2025.
    https://www.facebook.com/business/news/meta-shoptalk-2024
  • Pew Research Center. Americans’ Social Media Use 2025. Accessed on Dec 22, 2025.
    https://www.pewresearch.org/internet/2025/11/20/americans-social-media-use-2025
  • Pew Research Center. Social Media Fact Sheet. Accessed on Dec 22, 2025.
    https://www.pewresearch.org/internet/fact-sheet/social-media/
  • SendShort. Instagram Reels: Statistics & User-Growth (2025). Accessed on Dec 22, 2025.
    https://sendshort.ai/statistics/instagram-reels/
  • Sendshort. Shorts Statistics. Accessed on January 13, 2026.
    https://sendshort.ai/statistics/shorts/
  • Sendshort. TikTok Statistics. Accessed on January 13, 2026.
    https://sendshort.ai/statistics/tiktok/
  • Shopify. 28 Important Influencer Marketing Statistics To Know in 2025. Accessed on Dec 22, 2025.
    www.shopify.com/blog/influencer-marketing-statistics
  • Similar Web. Top Websites Ranking. Accessed on Dec 22, 2025.
    https://www.similarweb.com/top-websites
  • Social Insider. 2025 Instagram Benchmarks. Accessed on Dec 22, 2025.
    https://www.socialinsider.io/social-media-benchmarks/instagram
  • Social Insider. 2025 Social Media Video Performance Report. Accessed on Dec 22, 2025.
    https://www.socialinsider.io/social-media-benchmarks/social-media-video-statistics
  • Sprout Social. The Instagram algorithm: How it works and strategies for 2025. Accessed on Dec 22, 2025.
    https://sproutsocial.com/insights/instagram-algorithm/
  • Stack Influence. Instagram Posts vs. Reels: Which Is Better for Influencers in 2025?. Accessed on Dec 22, 2025.
    https://stackinfluence.com/instagram-posts-vs-reels-which-is-better/
  • Statista. Monthly Unique TikTok Users. Accessed on January 13, 2026.
    https://www.statista.com/statistics/1299807/number-of-monthly-unique-tiktok-users/?srsltid=AfmBOoqf7fwGMd1Gk3RBmxZpuFpL233WcJSgosY1zIALbTBufArZH6x7
  • Tubular Labs. Social Is the New Search: Part 2. Accessed on Dec 22, 2025.
    https://tubularlabs.com/research-guides/social-search-p2/
  • US Chamber. Are Short Form or Long Form Videos Better for Engagement. Accessed on Dec 22, 2025.
    https://www.uschamber.com/co/grow/marketing/are-short-form-or-long-form-videos-better-for-engagement
  • Wikipedia. List of Most Viewed Instagram Reels. Accessed on Dec 22, 2025.
    https://en.wikipedia.org/wiki/List_of_most-viewed_Instagram_reels
  • Wix. Video Marketing Statistics. Accessed on Dec 22, 2025.
    https://www.wix.com/blog/video-marketing-statistics
  • Zebracat. 100+ Instagram Reels Statistics Every Marketer Should Know. Accessed on Dec 22, 2025.
    https://www.zebracat.ai/post/instagram-reels-statistics
Maria Harutyunyan

Our blog covers a combination of industry trends and professional insights from behind-the-scenes experiences. We provide weekly updates on link building, content marketing, on-site and technical SEO, and more! Sign up for our newsletter and join our LinkedIn to be on top of industry trends!

Submit the form - Get Free Proposal

time icon

24 hours

Send me a free proposal
black arrow icon
Thanks for reaching out! We’ll send over our initial SEO assessment by email, then set up a quick 30-minute call with our team to walk you through the proposal.
Oops! Something went wrong while submitting the form.
Maria Harutyunyan
Our blog covers a combination of industry trends and professional insights from behind-the-scenes experiences dealing with every aspect of SEO. We provide weekly updates on topics such as link building, content marketing, on-site and technical SEO and more! Don’t miss any industry updates by signing up for our newsletter! You’ll also receive exclusive SEO strategies and learn about industry secrets like:

Don’t forget to share this post!

Twitter IconFacebook IconInstagram IconLinkedIn Icon

Submit the form - Get Free Proposal

time icon

24 hours

Send me a free proposal
black arrow icon
Thanks for reaching out! We’ll send over our initial SEO assessment by email, then set up a quick 30-minute call with our team to walk you through the proposal.
Oops! Something went wrong while submitting the form.

Ready to Grow Your Business?

Contact us to work with a results-driven SEO agency

Get SEO Tips & Tricks Every Week

Thank you! Your submission has been received!
Oops! Something went wrong while submitting the form.